The fundamental output of causal mapping is a database of causal links. If there are not too many links, this database can be visualised "as-is" in the form of a causal map or network. But usually there are too many links for this to be very useful, so we apply filters.
By applying filters and other algorithms, a causal map can be queried in different ways to answer different questions, for example to simplify it, to trace specific causal paths, to identify significantly different sub-maps for different groups of sources, etc.
As explained on the Causal Mapping website:
"A global causal map resulting from a research project can contain a large number of links and causal factors. By applying filters and other algorithms, a causal map can be queried in different ways to answer different questions, for example to simplify it, to trace specific causal paths, to identify significantly different sub-maps for different groups of sources, etc."
The figure below shows a map from the application Causal Map, showing coded causal statements for a project that provided farmers with agricultural training and advice in order to increase crop yields. The map has been filtered to show only outcomes downstream of the influence factor ‘Agricultural training and advice’. Numbers shown indicate how many times the links were mentioned across all interviews.

Source: BDSR, 2021, p 4
Here is the same kind of question inside the Causal Map app, using the shared example-original project. This bookmark asks a downstream question: what follows from Increased Knowledge?
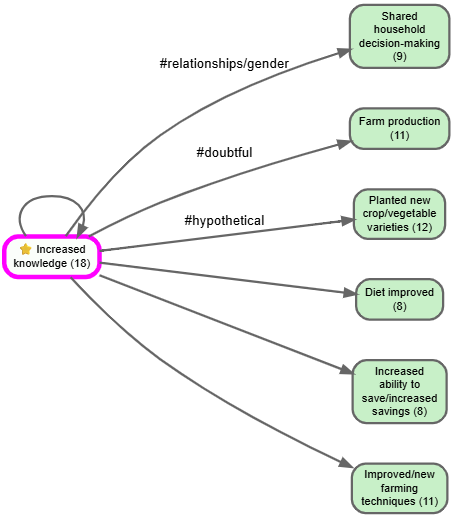
Bookmark #262 — looking downstream from one factor in a larger coded project. Open in app